 2016, Vol. 43
扩展功能
文章信息
- 胡洁云, 林露, 王彤, 陈敏, 严维凌
- HU Jie-Yun, LIN Lu, WANG Tong, CHEN Min, YAN Wei-Ling
- 熟鸡肉中金黄色葡萄球菌生长预测模型的建立
- Model for predicting Staphylococcus aureus growth in cooked chicken
- 微生物学通报, 2016, 43(9): 1999-2009
- Microbiology China, 2016, 43(9): 1999-2009
- DOI: 10.13344/j.microbiol.china.150738
-
文章历史
- 收稿日期: 2015-09-29
- 接受日期: 2016-01-04
- 优先数字出版日期(www.cnki.net): 2016-02-24


2. 上海市疾病预防控制中心 上海200336
2. Shanghai Municipal Center for Disease Control and Prevention,shanghai 200336,China
鸡肉加工产品具有低脂肪、高蛋白、低胆固醇等特点,且富含人体所必需的多种营养,因而越来越受到消费者的青睐。联合国粮食与农业组织认为:2016年之前,全球鸡肉类产品消费量将以每年2.0%的速度增长,然而各国之间贸易及运输链的迅速发展也加大了动物疾病蔓延的危险性[1]。在我国市场上的传统特色熟鸡肉制品的制作和销售过程中,由于环境卫生、加工工艺、贮藏及销售条件等影响,极易被食源性致病菌污染[2]。2013-2014年的上海市肉类食品抽样调查结果表明:鸡肉类产品中金黄色葡萄球菌的检出率最高可达32.9%[3]。金黄色葡萄球菌作为我国三大食源性致病菌之一,广泛存在于自然环境中,对各种理化因素都有较强的抵抗力,且易污染肉类食品;当金黄色葡萄球菌数量达到一定的数量级,可能会产生肠毒素,增加了潜在的食物中毒风险[4]。因此,无论在发达国家还是在发展中国家,金黄色葡萄球菌均被卫生防疫和进出口检疫等部门列为重点监测的食源性致病菌之一。
为了有效防控金黄色葡萄球菌对食品的污染,国内外相关学者对不同食品中金黄色葡萄球菌的生长预测模型进行了大量的研究[5-8]。早期的研究多采用单一的模型进行预测,且常用体系稳定的肉汤培养基作为微生物的生长环境,以利于收集模型数据[9-10];随着建模方法的日趋成熟,Gompertz、Baranyi和Logistic模型等多种模型被用于金黄色葡萄球菌的生长预测中,但各种模型的预测准确性均随着食品环境的不同而呈现出较大的差异[11-12]。因此,当微生物在复杂的食品环境中生长时,只有寻找最适合的模型才能相对更真实地反映微生物的生长情况。
本研究以熟鸡肉为研究对象,分析不同温度、不同接种浓度下金黄色葡萄球菌在熟鸡肉中的生长情况,比较3种常见生长预测模型的预测准确性,确定最适合的模型,并对所建立的一级和二级生长模型的可靠性进行验证,为进一步探讨建立金黄色葡萄球菌的产毒预测模型提供数据基础。
1 材料与方法 1.1 材料及预处理1.1.1 菌种:产A型肠毒素金黄色葡萄球菌SA14966[13],保存于营养琼脂斜面,-20 ℃冻存,至少每月转接一次。待用时,刮取一环菌苔,将其接入营养肉汤(g/L:蛋白胨10.0,牛肉粉3.0,氯化钠5.0,pH 7.2±0.2)中,37 ℃、100 r/min培养48 h,以上培养物即为初始接种物。
1.1.2 材料:超市购买的当天生产且包装完整的新鲜鸡脯肉,冷藏待用。
1.1.3 鸡肉的预处理:将鸡肉分割成块状,重量约为100 g,沸水中煮20 min后置于无菌的篮框中沥水,水沥净后置于不同接种浓度的菌液中浸泡 30 min,取出后沥干残留菌液,无菌包装袋分装后置于不同的温度条件下贮藏待用。
1.2 实验方法1.2.1 不同温度下生长曲线的测定:设置15-36 ℃温度范围内均匀分布的4个温度梯度15、22、29和36 ℃,稀释初始接种液使得初始菌数为102、103和104 CFU/g,分别接种到熟鸡肉中,每间隔3 h (36、29 ℃)和6 h (15、22 ℃)取样,用PetrifilmTM金黄色葡萄球菌测试片(3M公司)进行计数(GB 4789.10-2008)。取样过程应在尽量短的时间内完成,以减少温度波动的影响。
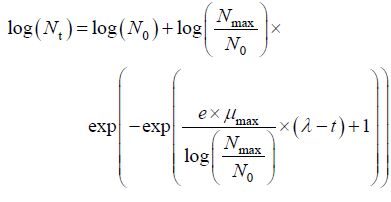
1.2.2 金黄色葡萄球菌生长的初级预测模型:初级模型描述的是微生物数量变化与时间的关系,用Matlab软件分析不同温度和不同接种浓度的金黄色葡萄球菌在熟鸡肉中的生长数据,拟合S型曲线,建立生长模型。通过比较3种模型的拟合指标,确定最适模型。
修正的Gompertz模型[14]:
|
(1) |
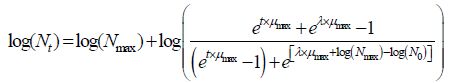
修正的Logistic方程[15]:

|
(2) |
|
(3) |
式中:log(Nt)为在t时刻细菌数的对数值; log(N0)为初始细菌数的对数值;log(Nmax)为最大细菌数(即在稳定期)的对数值;λ为微生物学意义上的迟滞期;μmax为微生物生长的最大比生长速率。
1.2.3 金黄色葡萄球菌的二级生长预测模型的建立:应用Matlab软件建立不同接种量和不同温度与生长参数(迟滞期、最大比生长速率)之间的响应面方程,方程如下[18]:

|
(4) |
式中:Y为细菌的生长特征参数(迟滞期、最大比生长速率);P表示接种量浓度;T表示温 度;b1、b2、b3...b 5是参数;δ是误差项,计算时可忽略。
1.3 预测模型的验证与检验在得到了最大比生长速率μmax和迟滞期λ对温度和接种浓度的响应面方程之后,在实验设定的温度(15-36 ℃)与接种量浓度(102、103和104 CFU/g)范围内,随机设定2个温度(20 ℃和32 ℃),1个接种量浓度(103 CFU/g),每组温度分别做5个平行,作为验证组的数据。按照上述方法采用Matlab软件拟合生长曲线,计算最大比生长速率μmax和迟滞期λ。
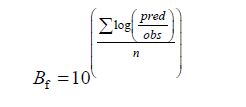
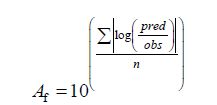
用所建的二级预测模型方程对建模的数据组和用于验证的数据组分别拟合,预测最大比生长速率μmax和迟滞期λ,用标准预测误差(Standard Error of Prediction,SEP)[19]、平方根误差(Root-Mean-Squares Error,RMSE)、偏差因子(Bias factor,Bf)和准确因子(Accuracy factor,Af)[20-21]作为衡量模型的标准,公式如下:
|
(5) |
|
(6) |

|
(7) |

|
(8) |
式中:obs为用修正的Gompertz模型拟合生长模型的参数μmax或λ的观测值;pred为用建立的RSM方程得出的对μmax和λ的预测值,mean obs为μmax或λ观测值的平均值;n为测定重复数。
1.4 数据分析采用Matlab的统计软件对金黄色葡萄球菌的生长数据进行非线性回归拟合。用残差分析、RSS、RSE及AIC来整体评价3种初级模型的拟合能力。RSS和RSE值越小,模型拟合效果越好。AIC是衡量统计模型拟合优良性的一种标准,在不同的温度条件下对实验数据进行拟合,AIC值最小的模型是最准确的模型[22]。

|
(9) |
式中:n为实验数据的总数,yi是第i小时测定的实验数据,

|
(10) |
式中,n为实验数据的总数,p为模型中参数的个数。
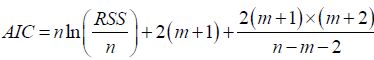
|
(11) |
式中,n为实验数据的总数,m为模型中参数的个数。
2 结果与分析 2.1 3种初级模型拟合度的比较2.1.1 金黄色葡萄球菌的生长情况:15-36 ℃不同浓度金黄色葡萄球菌在熟食鸡肉中的生长情况见图 1。

|
| 图 1 15-36 ℃温度条件下金黄色葡萄球菌的生长 Figure 1 he growth of Staphylococcus aureus at 15-36 ℃ Note: A: 36 ℃; B: 29 ℃; C: 22 ℃; D: 15 ℃. |
|
|
2.1.2 残差分布:在15-36 ℃条件下,102、103和104 CFU/g接种浓度下,3种模型的残差值均围绕残差等于零的直线上下随机分布,说明回归曲线对实验值的拟合情况良好。相对于修正的Logistic模型和Baranyi模型来说,修正的Gompertz模型的残差值分布更为集中,大部分都在±0.15的范围内波动(图 2和图 3)。

|
| 图 2 36 ℃和29 ℃温度条件下金黄色葡萄球菌在熟鸡肉中的生长 Figure 2 The growth of Staphylococcus aureus in cooked chicken at 36 ℃ and 29 ℃ Note: A: 36 ℃,102 CFU/g; B: 36 ℃,103 CFU/g; C: 36 ℃,104 CFU/g; D: 29 ℃,102 CFU/g; E: 29 ℃,103 CFU/g; F: 29 ℃,104 CFU/g. |
|
|

|
| 图 3 22 ℃和15 ℃温度条件下金黄色葡萄球菌在熟鸡肉中的生长 Figure 3 The growth of Staphylococcus aureus in cooked chicken at 22 ℃ and 15 ℃ Note: A: 22 ℃,102 CFU/g; B: 22 ℃,103 CFU/g; C: 22 ℃,104 CFU/g; D: 15 ℃,102 CFU/g; E: 15 ℃,103 CFU/g; F: 15 ℃,104 CFU/g. |
|
|
2.1.3 拟合度统计指标的分析:目前,尚没有一个单独且简单的统计方法来评价非线性模型之间的异同及解决如何优先选择一个模型的问题。一般情况下,主要通过残差分布和拟合度统计指标的分析来进行不同非线性模型之间的比较,从而综合评价模型的整体拟合能力[23]。本实验用RSS、RSE及AIC来整体评价3种初级模型的拟合能力。
表 1和表 2反映的是15-36 ℃温度条件下 3种模型统计指标的比较分析,结果显示:36 ℃或29 ℃条件下,修正的Gompertz模型拟合的RSS、AIC和RSE值是最小的;接种量为102 CFU/g、温度为22 ℃或15 ℃条件下,RSS、AIC和RSE值最小的仍然是修正的Gompertz模型,其余2个接种量拟合度统计指标值最小的则分别是修正的Logistic模型和Baranyi模型。在本实验条件下,3种模型的最优拟合度的规律性不强,综合残差分析结果,认为修正的Gompertz模型对15-36 ℃温度条件下的实验数据表现出较好的拟合效果。
| 拟合度 goodness-of-fit | 模型 Model | 接种量 Inoculation concentration (CFU/g) | ||||||
| 36 ℃ | 29 ℃ | |||||||
| 102 | 103 | 104 | 102 | 103 | 104 | |||
| RSS | modified Gompertz model | 0.069 9 | 0.579 4 | 1.002 1 | 0.230 0 | 0.042 7 | 0.077 7 | |
| modified Logistic model | 2.211 7 | 1.065 4 | 1.668 7 | 0.354 9 | 0.137 1 | 0.122 8 | ||
| Baranyi model | 0.987 6 | 0.657 6 | 1.189 6 | 0.273 2 | 0.081 6 | 0.112 3 | ||
| AIC | modified Gompertz model | -49.353 4 | -21.867 1 | -38.645 6 | -33.878 3 | -55.754 5 | -47.995 0 | |
| modified Logistic model | -4.454 0 | -13.948 8 | -11.679 3 | -28.241 4 | -40.609 2 | -42.031 6 | ||
| Baranyi model | -14.935 3 | -20.221 7 | -36.388 7 | -31.641 4 | -47.345 1 | -43.200 9 | ||
| RSE | modified Gompertz model | 0.088 2 | 0.253 7 | 0.121 9 | 0.159 9 | 0.068 9 | 0.092 9 | |
| modified Logistic model | 0.495 7 | 0.344 1 | 0.375 5 | 0.198 6 | 0.123 4 | 0.116 8 | ||
| Baranyi model | 0.331 3 | 0.270 3 | 0.445 2 | 0.174 2 | 0.095 2 | 0.111 7 | ||
| 拟合度 goodness-of-fit | 模型 Model | 接种量 Inoculation concentration (CFU/g) | ||||||
| 36 ℃ | 29 ℃ | |||||||
| 102 | 103 | 104 | 102 | 103 | 104 | |||
| RSS | modified Gompertz model | 0.536 8 | 0.609 4 | 0.266 4 | 0.002 4 | 0.027 8 | 0.023 7 | |
| modified Logistic model | 1.152 4 | 0.305 3 | 0.405 9 | 0.008 3 | 0.020 0 | 0.023 5 | ||
| Baranyi model | 0.873 6 | 0.487 9 | 0.235 1 | 0.008 6 | 0.022 9 | 0.021 3 | ||
| AIC | modified Gompertz model | -22.861 1 | -21.211 8 | -31.969 9 | -93.144 5 | -61.709 8 | -63.445 2 | |
| modified Logistic model | -12.928 8 | -30.196 3 | -26.495 4 | -77.044 9 | -65.623 4 | -61.553 7 | ||
| Baranyi model | -16.529 6 | -24.102 7 | -33.596 2 | -76.648 8 | -26.897 | -64.826 6 | ||
| RSE | modified Gompertz model | 0.244 2 | 0.260 2 | 0.172 3 | 0.016 4 | 0.054 8 | 0.051 3 | |
| modified Logistic model | 0.357 8 | 0.184 2 | 0.212 4 | 0.030 4 | 0.047 2 | 0.051 1 | ||
| Baranyi model | 0.311 6 | 0.232 8 | 0.161 6 | 0.030 9 | 0.050 4 | 0.048 6 | ||
通过Matlab统计软件,采用非线性回归,将各温度下金黄色葡萄球菌的生长数据用修正Gompertz模型进行拟合,最大比生长速率 μmax [lg CFU/(mL·h)]、生长迟滞期λ (h)和最大细胞密度MPD (lg CFU/mL)结果见表 3。
| 项目 Item | 接种量 Inoculation concentration (CFU/g) | |||||||||||||||
| 36 ℃ | 29 ℃ | 22 ℃ | 15 ℃ | |||||||||||||
| 102 | 103 | 104 | 102 | 103 | 104 | 102 | 103 | 104 | 102 | 103 | 104 | |||||
| 最大比生长速率 Maximum specific growth rate [lg CFU/(mL·h)] | 0.831 | 0.769 | 0.599 | 0.420 | 0.234 | 0.215 | 0.189 | 0.177 | 0.165 | 0.053 | 0.047 | 0.040 | ||||
| 迟滞期 Lag phase (h) | 1.912 | 1.615 | 0.726 | 3.681 | 2.735 | 1.191 | 15.040 | 12.780 | 11.430 | 13.100 | 16.430 | 19.070 | ||||
| 最大细胞密度 Maximum population density (lg CFU/mL) | 8.871 | 8.672 | 8.733 | 8.293 | 8.694 | 8.446 | 7.478 | 7.255 | 7.472 | 5.815 | 5.232 | 5.283 | ||||
表 3结果显示:在相同的接种量条件下,金黄色葡萄球菌最大比生长速率随着温度升高而增大,即金黄色葡萄球菌生长速率随着温度的升高而增大;在相同的温度条件下,最大比生长速率随着初始接种量浓度的增加而降低,即金黄色葡萄球菌的生长速率随着接种量的降低而增大。随着温度的升高,生长迟滞期缩短。初始接种量102-104 CFU/g的金黄色葡萄球菌在不同温度下生长迟滞期顺序为:36 ℃ (1.912,1.615,0.726)<29 ℃ (3.681,2.735,1.191)<22 ℃ (15.040,12.780,11.430)<15 ℃ (13.100, 16.430,19.070)。
在36 ℃和29 ℃下,生长迟滞期的趋势并不明显;22 ℃下,迟滞期随着接种浓度的增加而显著降低;15 ℃时,迟滞期随着初始菌的增加反而延长了,因为温度较高时,接种菌浓度越大,进入对数期就越快,迟滞期越短;而温度较低时,接种菌浓度越大,越接近最大细胞密度(约为5 lg CFU/mL),最大比生长速率降低,细菌生长趋势接近于平缓,迟滞期变长。
从最大细菌密度MPD (lg CFU/mL) 可以看出,相同温度条件下,不同接种量浓度的金黄色葡萄球菌的MPD之间相差不大,但随着温度的降低,MPD在减小,初始接种量102-104 CFU/g的金黄色葡萄球菌在不同温度下的最大生长密度顺序为:36 ℃ (8.871,8.672,8.733)>29 ℃ (8.293,8.694,8.446)>22 ℃ (7.478,7.255,7.472)>15 ℃ (5.815,5.232,5.283)。
2.3 二级生长预测模型的建立本研究中的金黄色葡萄球菌的生长曲线参数μmax和λ都采用了常用对数的变化,以达到均一化的目的[24]。后用逐步回归法建立最大比生长速率、迟滞期对温度(T)和接种量浓度(P)的响应面图形结果见图 4,方程如下:

|
(12) |

|
(13) |

|
| 图 4 最大比生长速率(A)和迟滞期(B)的响应面图 Figure 4 The maximum specific growth rate (A) and the lag phase (B) of the response surface |
|
|
由方程(12)和(13)结果说明:自变量能够解释因变量91%以上的变化,模型拟合效果好,对参数进行方差分析,模型和各系数均显著(P<0.05),说明所建立的二级模型是适合的。
2.4 预测方程的数学检验应用建立的RSM生长预测方程分别对建模的12组数据和验证的2组数据进行生长参数的观测值和预测值的比较,见表 4和表 5。
| 温度 Temperature (℃) | 接种浓度 Inoculation concentration (CFU/g) | 最大比生长速率 Maximum specific growth rate (lg cfu/(mL·h)) | 迟滞期 Lag phase (h) | |||
| 实测值 Measured value | 预测值 Predictive value | 实测值 Measured value | 预测值 Predictive value | |||
| 36 | 102 | 0.832±0.173 | 0.829±0.186 | 1.912±0.220 | 1.962±0.222 | |
| 103 | 0.769±0.053 | 0.762±0.061 | 1.615±0.219 | 1.609±0.211 | ||
| 104 | 0.599±0.106 | 0.600±0.103 | 0.726±0.189 | 0.733±0.190 | ||
| 29 | 102 | 0.420±0.060 | 0.410±0.068 | 3.681±0.323 | 3.637±0.353 | |
| 103 | 0.235±0.497 | 0.247±0.493 | 2.735±0.111 | 2.716±0.110 | ||
| 104 | 0.215±0.353 | 0.218±0.359 | 1.191±0.273 | 1.192±0.268 | ||
| 22 | 102 | 0.175±0.075 | 0.179±0.073 | 15.04±0.088 | 15.02±0.081 | |
| 103 | 0.189±0.367 | 0.181±0.369 | 12.78±0.072 | 12.82±0.071 | ||
| 104 | 0.165±0.258 | 0.161±0.249 | 11.43±0.155 | 11.39±0.151 | ||
| 15 | 102 | 0.047±0.397 | 0.051±0.390 | 13.10±0.975 | 13.15±0.970 | |
| 103 | 0.053±0.071 | 0.055±0.073 | 16.43±0.169 | 16.45±0.165 | ||
| 104 | 0.040±0.099 | 0.038±0.090 | 19.07±0.084 | 19.09±0.086 | ||
| 接种量 Inoculation concentration (CFU/g) | 实验次数 Experiment times (n) | 温度 Temperature (℃) | 最大比生长速率 Maximum specific growth rate (lg CFU/(mL·h)) | 迟滞期 Lag phase (h) | |||
| 实测值 Measured value | 预测值 Predictive value | 实测值 Measured value | 预测值 Predictive value | ||||
| 103 | 5 | 20 | 0.41±0.193 | 0.39±0.172 | 1.53±0.111 | 1.51±0.104 | |
| 32 | 0.11±0.357 | 0.09±0.322 | 15.29±0.138 | 15.31±0.061 | |||
对建模和验证的试验组分别应用数学检验参数进行内部检验(Internal validation)和外部检验(External validation)[25]。结果见表 6:较低的%SEP和RMSE数值表明模型有较好的拟合性(goodness-of-fit),建立的预测方程Af和Bf都接近于 1,都是在可接受范围内的。
| 指标 Index | %SEP | RSME | Bf | Af |
| μmax | 0.034 1 | 0.001 1 | 0.957 6 | 1.150 8 |
| λ | 0.075 5 | 0.081 9 | 1.042 1 | 1.183 1 |
| μmax* | 0.016 9 | 0.063 8 | 1.053 9 | 1.001 6 |
| λ* | 0.094 6 | 0.026 4 | 0.960 3 | 1.203 8 |
| 注:μmax和λ分别为用于建模组的最大比生长速率和迟滞期,μmax*和λ*分别为用于验证组的最大比生长速率和迟滞期. | ||||
| Note: The row ofμmax and λ were the results of internal evaluation for modeling establishing,the row of μmax* and λ* were the results of external evaluation for modeling validation. | ||||
(1) 本实验选择了15、22、29和36 ℃ 4个温度,102、103和104 CFU/g 3个接种量浓度,将金黄色葡萄球菌接种在熟鸡肉中,选择3种常见的初级预测模型,经过残差和拟合度指标的分析,结果显示:36 ℃和29 ℃条件下,修正的Gompertz模型最适合;22 ℃和15 ℃条件下,102 cfu/g接种量中,修正的Gompertz模型优于修正的Logistic模型和Baranyi模型,103 cfu/g接种量时修正的Logistic模型最适合,104 cfu/g接种量时Baranyi模型拟合最好,综合考虑模型的拟合效果以及接下来开展实验的难易程度,最终选择修正的Gompertz模型建立金黄色葡萄球菌生长的初级模型。
(2) 从建立生长预测模型的角度来看,环境因素对微生物的生长有着显著的影响[26]。本实验利用Matlab软件丰富的函数资源,通过修正的Gompertz模型成功拟合出不同温度和不同接种量浓度的金黄色葡萄球菌在熟鸡肉中的初级模型,通过响应曲面模型得出了最大比生长速率和迟滞期与温度和接种量的关系。结果表明:随着温度的升高,对数期的生长速率是随着接种量浓度的升高而减缓的,而迟滞期是随着接种量浓度的升高而缩短的。
(3) 对不同温度、不同接种量浓度的金黄色葡萄球菌在熟鸡肉中生长建立模型之后,我们计算了预测模型的准确因子(Af)和偏差因子(Bf)。如果两者接近1,则表示预测模型的可靠程度高[16]。但是,Garcia-Gimeno等认为这两个数值仅能检验用于评价数据的表面差异,不能衡量预测模型的绝对误差,因此建议应用不依赖测定数量的%SEP作为检验预测方程好坏的标准[27]。结果显示:用于建模和验证的%SEP数值均较低,且模型的准确因子(Af)和偏差因子(Bf)均接近1,因此说明:本实验建立的预测方程适合预测不同温度、不同接种浓度条件下金黄色葡萄球菌在熟鸡肉中的生长情况。
(4) 金黄色葡萄球菌是常见的食源性致病菌之一,目前国内外学者对金黄色葡萄球菌建模和检测产生毒素的报道有很多,但对金黄色葡萄球菌产毒的预测或建立产毒模型目前尚有困难且无相关报道。虽然金黄色葡萄球菌普遍存在于环境、人体和生鲜食品中,但并非所有的菌株都产毒素,只有当金黄色葡萄球菌数量积累到一定程度时,才会产生毒素。因此,课题组首先借助预测微生物学的方法建立了金黄色葡萄球菌在熟鸡肉的生长模型,为今后尝试研究金黄色葡萄球菌的细菌浓度与产毒时间是否存在一定联系提供数据基础,进而探讨通过生长模型预测菌落总数来间接预测产毒风险的可操作性。目前这一研究正在进行中,成果将在之后的论文中体现。
| [1] | Chen J, Gu QF, Liu C, et al. Monitoring results on food-borne pathogens in food in Shanghai from 2011 to 2012[J]. Shanghai Journal of Preventive Medicine , 2014, 26 (4) : 169–172. (in chinese) 陈炯, 顾其芳, 刘诚, 等. 2011-2012年上海市食品中食源性致病菌的监测结果分析[J]. 上海预防医学 , 2014, 26 (4) : 169–172. |
| [2] | Sun CH, Wang YH, Zhu WQ, et al. Causes analysis of deterioration of meat products[J]. Journal of Microbiology , 2011, 31 (3) : 106–109. (in chinese) 孙翠焕, 王艳华, 朱万芹, 等. 肉制品腐败变质原因分析[J]. 微生物学杂志 , 2011, 31 (3) : 106–109. |
| [3] | Li ZR, Shi CL, Song MH, et al. Distribution status of food-borne staphylococcus aureus in Shanghai[J]. Food Science , 2013, 34 (1) : 268–271. (in chinese) 李自然, 施春雷, 宋明辉, 等. 上海市食源性金黄色葡萄球菌分布状况[J]. 食品科学 , 2013, 34 (1) : 268–271. |
| [4] | Fischer A, Francois P, Holtfreter S, et al. Development and evaluation of a rapid strategy to determine enterotoxin gene content in Staphylococcus aureus[J]. Journal of Microbiological Methods , 2009, 77 (2) : 184–190. DOI:10.1016/j.mimet.2009.01.022 |
| [5] | Liu XH, Xiong R, Jia YM, et al. Establishment of growth kinetics model of Staphylococcus aureus in spinach[J]. Journal of Food Safety & Quality , 2014, 5 (5) : 1495–1500. (in chinese) 刘晓慧, 熊蕊, 贾月梅, 等. 金黄色葡萄球菌在菠菜中生长预测模型的建立[J]. 食品安全质量检测学报 , 2014, 5 (5) : 1495–1500. |
| [6] | Han Q, Chen Q, Sun FD, et al. Construction of growth kinetics model of Staphylococcus aureus in dumplings fillers[J]. Science and Technology of Food Industry , 2013, 34 (23) : 93–96. (in chinese) 韩齐, 陈倩, 孙方达, 等. 水饺馅料中金黄色葡萄球菌预测模型的建立[J]. 食品工业科技 , 2013, 34 (23) : 93–96. |
| [7] | Wu XL, Su YC. Growth of Staphylococcus aureus and enterotoxin production in pre-cooked tuna meat[J]. Food Control , 2014, 42 : 63–70. DOI:10.1016/j.foodcont.2014.01.039 |
| [8] | Rodriguez-Caturla MY, Díaz AV, Vallejo JLR, et al. Effect of pre-incubation conditions on growth and survival of Staphylococcus aureus in sliced cooked chicken breast[J]. Meat Science , 2012, 92 (4) : 409–416. DOI:10.1016/j.meatsci.2012.05.003 |
| [9] | Li JC, Zhou T, Li JP, et al. Modeling Staphylococcus aureus growth as a function of different conditions in nutrient broth[J]. Meat Research , 2015, 29 (3) : 5–10. (in chinese) 李金春, 周彤, 李家鹏, 等. 营养肉汤中不同因素影响下金黄色葡萄球菌生长模型的构建[J]. 肉类研究 , 2015, 29 (3) : 5–10. |
| [10] | Saren GW, Hu WZ, Gao CH, et al. Predictive modeling of the growth of Listeria monocytogenes on nutrient broth[J]. Science and Technology of Food Industry , 2013, 34 (17) : 173–176. (in chinese) 萨仁高娃, 胡文忠, 高春红, 等. 不同初始浓度的单增李斯特菌在营养肉汤中生长预测模型的建立[J]. 食品工业科技 , 2013, 34 (17) : 173–176. |
| [11] | Zhou k, Fu P, Li PL, et al. Predictive modeling and validation of growth at different temperatures of Brochothrix thermosphacta[J]. Journal of Food Safety , 2009, 29 (3) : 460–473. DOI:10.1111/jfs.2009.29.issue-3 |
| [12] | Xiong R, Xie G, Edmondson AS, et al. Comparison of the Baranyi model with the modified Gompertz equation for modelling thermal inactivation of Listeria monocytogenes Scott A[J]. Food Microbiology , 1999, 16 (3) : 269–279. DOI:10.1006/fmic.1998.0243 |
| [13] | Wang T. The research of the growth of Staphylococcus aureus,enterotoxigenic condition and its inhibition method in whipped cream[D]. Shanghai: Master’s Thesis of Shanghai Ocean University,2015 (in Chinese) 王彤. 金黄色葡萄球菌在搅打奶油中的生长、产肠毒素条件及其抑制方法研究[D]. 上海: 上海海洋大学硕士学位论文,2015 |
| [14] | Zwietering MH, Jongenburger I, Rombouts FM, et al. Modeling of the bacterial growth curve[J]. Applied and Environmental Microbiology , 1990, 56 (6) : 1875–1881. |
| [15] | Gibson AM, Bratchell N, Roberts TA. Predicting microbial growth: growth responses of salmonellae in a laboratory medium as affected by pH,sodium chloride and storage temperature[J]. International Journal of Food Microbiology , 1988, 6 (2) : 155–178. DOI:10.1016/0168-1605(88)90051-7 |
| [16] | Baranyi J, Roberts TA. A dynamic approach to predicting bacterial growth in food[J]. International Journal of Food Microbiology , 1994, 23 (3/4) : 277–294. |
| [17] | Baranyi J, Robinson TP, Kaloti A, et al. Predicting growth of Brochothrix thermosphacta at changing temperature[J]. International Journal of Food Microbiology , 1995, 27 (1) : 61–75. DOI:10.1016/0168-1605(94)00154-X |
| [18] | Sutherland JP, Bayliss AJ, Braxton DS, et al. Predictive modelling of Escherichia coli O157:H7: inclusion of carbon dioxide as a fourth factor in a pre-existing model[J]. International Journal of Food Microbiology , 1997, 37 (2/3) : 113–120. |
| [19] | Herv’s C, Zurera G, Garcia RM, et al. Optimization of computational neural network for its application in the prediction of microbial growth in foods[J]. Food Science and Technology International , 2001, 7 (2) : 159–163. DOI:10.1177/108201320100700209 |
| [20] | Ross T. Indices for performance evaluation of predictive models In food microbiology[J]. Journal of Applied Bacteriology , 1996, 81 (5) : 501–508. DOI:10.1111/jam.1996.81.issue-5 |
| [21] | Baranyi J, Pin C, Ross T. Validating and comparing predictive models[J]. International Journal of Food Microbiology , 1999, 48 (3) : 159–166. DOI:10.1016/S0168-1605(99)00035-5 |
| [22] | Niu HM, Li MY, Zhao GM, et al. Comparison of kinetics models for Pseudomonas growth in chilled pork at low temperature[J]. Food Science , 2013, 34 (5) : 142–146. (in chinese) 牛会敏, 李苗云, 赵改名, 等. 低温条件下冷却猪肉中假单胞菌生长模型的比较分析[J]. 食品科学 , 2013, 34 (5) : 142–146. |
| [23] | López S, Prieto M, Dijkstra J, et al. Statistical evaluation of mathematical models for microbial growth[J]. International Journal of Food Microbiology , 2004, 96 (3) : 289–300. DOI:10.1016/j.ijfoodmicro.2004.03.026 |
| [24] | García-Gimeno RM, Barco E, Rincón F, et al. Response surface model for the estimation of Escherichia Coli O 157:H7 growth under different experimental conditions[J]. Journal of Food Science , 2005, 70 (1) : M30–M36. DOI:10.1111/j.1365-2621.2005.tb09043.x |
| [25] | McClure PJ, Beaumont AL, Sutherland JP, et al. Predictive modelling of growth of Listeria monocytogenes the effects on growth of NaCl,pH,storage temperature and NaNO2[J]. International Journal of Food Microbiology , 1997, 34 (3) : 221–232. DOI:10.1016/S0168-1605(96)01193-2 |
| [26] | Dong QL, Guo LY, Tu K, et al. Development of prediction model for Clostridium sporogenes spores growth under different experimental conditions[J]. Journal of Zhejiang University (Agriculture & Life Sciences) , 2007, 32 (2) : 162–168. (in chinese) 董庆利, 郭黎洋, 屠康, 等. 不同试验条件下生孢梭菌孢子生长预测方程的建立[J]. 浙江大学学报: 农业与生命科学版 , 2007, 32 (2) : 162–168. |
| [27] | Garcíaa-Gimeno RM, Hervás-Martíanez C, Barco-Alcalá E, et al. An artificial neural network approach to Escherichia coli O157:H7 growth estimation[J]. Journal of Food Science , 2003, 68 (2) : 639–645. DOI:10.1111/jfds.2003.68.issue-2 |