扩展功能
文章信息
- 李寒, 张晓黎, 郭晓红, 宋延静, 龚骏
- LI Han, ZHANG Xiao-Li, GUO Xiao-Hong, SONG Yan-Jing, GONG Jun
- 滨海盐渍化土壤中蓝细菌多样性及分布
- Diversity and distribution of cyanobacteria in coastal saline soils
- 微生物学通报, 2015, 42(5): 957-967
- Microbiology China, 2015, 42(5): 957-967
- 10.13344/j.microbiol.china.140897
-
文章历史
- 收稿日期: 2014-11-10
- 接受日期: 2015-01-07
- 优先数字出版日期(www.cnki.net): 2015-02-10
2. 中国科学院大学 北京 100049
2. University ofChinese Academy ofSciences, Beijing 100049, China
蓝细菌(蓝藻、蓝绿藻)是一类具有光合自养功能的古老原核生物,迄今已经有数十亿年的历史。作为先锋物种以及初级生产者,蓝细菌在全球碳氮循环中扮演着十分重要的角色[1,2]。蓝细菌分布非常广泛,许多蓝细菌具有独特的固氮能力和生长机制。研究表明,蓝细菌能够在贫瘠甚至极端环境(如盐湖、热泉、沙漠、极地等)中生存[3,4,5]。蓝细菌分泌的胞外多糖能够提高土壤的水肥持留能力,吸附土壤中重金属等物质,对于改良退化土壤具有重要意义[6,7,8]。
盐度对水域生态系统中蓝细菌的群落组成和分布具有重要影响[9,10,11]。Garcia-Pichel等证实某些蓝细菌可在28%-34%的盐度环境中生存[12],而Häusler等发现蓝细菌在死海中可忍受的最高盐度为24.5%,且随着盐度的升高,细胞活性逐渐降低并趋于稳定[13]。Green等发现,在一定的盐度范围内,微生物垫中蓝细菌的优势类群组成比较稳定[14],通过对巴哈马群岛盐池微生物垫的分析发现,随着上覆水盐度剧烈的年际变化,蓝细菌的群落组成发生明显的改变[15]。在巴西红树林盐度梯度沉积物中,近海高盐样品之间蓝细菌组成非常相近,而高盐与低盐样品之间蓝细菌组成差异较大[16]。时玉等在青藏高原淡水湖与盐水湖沉积物调查中发现,蓝细菌只存在于盐水湖沉积物中[17]。这些研究表明,蓝细菌对环境盐胁迫具有一定的适应性,在不同盐度环境中蓝细菌会形成独特的群落结构。尽管如此,盐渍化土壤中蓝细菌的多样性与群落结构研究较少,对于土壤盐度是控制蓝细菌群落变化的主要环境因子的观点还未见证据明确支持。
莱州湾南岸平原是中国北方受海水入侵影响最为严重的地区[18],土壤呈现明显的梯度盐渍化特征[19]。本研究利用一系列微生物分子生态学分析方法,以莱州湾南岸平原由沿海到陆地不同盐度梯度下的土壤样品为研究对象,对在该环境下的蓝细菌的分子多样性、分布特征及驱动因子进行了深入解析,以验证盐度是影响土壤蓝细菌分布的主要因子的假设。
1 材料与方法 1.1 研究区概况莱州湾南岸平原,沿海岸线东西绵延2 870 km,是我国典型的粉沙、泥质海岸岸段,地貌类型由南部的山前冲积平原过渡到中部的冲积海积平原再到滨海海积平原。自20世纪70年代以来,莱州湾南岸海水入侵日趋严重[19],尤其是随着地区经济的发展,地下水过度开采以及地表径流减少,导致地下淡水与咸卤水之间所建立起的天然平衡状态被打破,引起咸水入侵,自沿海向陆地形成了典型的梯度盐渍化环境。大面积土地盐渍化使当地生态平衡遭到严重破坏,已成为阻碍区域经济发展的主要因素[20,21,22]。
1.2 样品采集研究区域地理位置为119°09′−119°36′E,36°56′−37°46′N,分别在该区域四条河流(黄河、白浪河、堤河、胶莱河)附近布设4个断面,12个站位(图1,表1)。其中,黄河口断面4个站位(YR01−04),白浪河断面2个站位(BR01,02),堤河断面2个站位(DR01,02),胶莱河断面4个站位(JR01−04)。2012年7月利用直径为3 cm的土钻采集表层0−5 cm土壤样品,每个站位五点法取样混匀,迅速置于移动冰箱带回实验室−80℃保存,用于测定土样理化因子和蓝细菌的群落组成。

|
| 图 1 莱州湾南岸平原及黄河口盐度梯度土壤样品采样站位图 Figure.1 Location of 12 sampling sites in the southern coastal plain of Laizhou Bay and near the mouth of the Yellow River |
1.3.1 实验菌株和培养基:克隆文库所用感受态细胞:大肠杆菌DH5α[23];LB培养基配方(g/L):国产胰蛋白胨10,酵母提取物5,NaCl 10,pH 7.0。
1.3.2 主要材料和试剂:Ultra Clean Soil DNA Isolation Kit土壤提DNA试剂盒,美国MOBIO;PCR引物,上海生工生物工程技术服务有限公司;10×PCR Buffer、MgCl2、dNTP mix、TaqDNA酶、限制性内切酶Msp I和Hha I、Ins TA clone PCR Cloning Kit克隆试剂盒、Maxima SYBR Green PCR/RoxqPCR Master Mix,美国Fermentas;胶回收试剂盒,北京天根生化科技有限公司。
1.3.3主要仪器与设备:连续流动分析仪,德国Seal;微量元素分析仪,德国Hanau;微量紫外分光光度计,美国Thermo;5424高速离心机,德国Eppendorf;Vortex genie涡旋振荡器,德国IKA;BSA224S电子天平,德国赛多利斯;SHZ-82气浴恒温振荡器,常州国华;JY600C电泳仪,北京君意东方;蓝盾580可见光电泳投射仪,厦门百维信;普通PCR仪,德国Biometra;ABI-PRISM3730测序仪、ABI 7500 Fast荧光定量PCR仪,美国ABI。
1.4 方法1.4.1 土壤理化因子测定:参考Guo等的土壤理化因子测定方法[24],利用2 mol/L KCl溶液浸提土壤样品,并利用连续流动分析仪测定土壤氨氮、硝态氮和亚硝态氮含量;采用燃烧法利用微量元素分析仪测定土壤总有机碳氮含量,处理温度分别为1 250℃和450℃;土壤pH值测定采用电位法;盐度利用测定水土比为1:5土壤溶液的电导率来获得;土壤含水量参考Gardner的干法测定[25]。
1.4.2 土壤总DNA提取:称取0.5−1.0 g土壤样品,利用Ultra Clean Soil DNA Isolation Kit试剂盒,按照说明书提取总DNA,获得的DNA样品经NanoDrop 2000C微量紫外分光光度计检测质量,−80℃保存。
1.4.3 自动核糖体间隔基因分析(Automated rRNA intergenic spacer analysis,ARISA):以土壤总DNA为模板,利用特异性引物Cya-ARISA-F (5′-FAM-GYCAYRCCCGAAGTCRTTAC-3′)和23S30R (5′-CH TCGCCTCTGTGTGCCWAGGT-3′)[26]扩增蓝细菌核糖体间隔基因16S-ITS-23S序列。反应体系如下:正反向引物(10 μmol/L)各1.0 μL,10×PCR buffer 2.5 μL,25 mmol/L MgCl2 2.5 μL,10 nmol/L dNTP mix 0.5 μL,1 U Taq DNA酶0.2 μL,模板DNA 1 μL,无菌去离子水补足至25 μL。扩增条件:94 ° C 2 min;94 ° C 45 s,50℃ 30 s,72℃ 2 min,35个循环;72℃ 7 min。PCR产物利用DNA凝胶回收试剂盒纯化回收,并通过1%琼脂糖凝胶电泳检测。为弥补PCR反应扩增效率的不足,以及尽可能真实地反映样品中蓝细菌多样性,每个站位PCR反应分别设置3个重复,最终混合作为一个样品。所有操作过程均在弱光条件下操作。PCR产物由生工生物工程(上海)股份有限公司分析测定。所得ARISA数据,片段长度差别大于2 bp则认为片段是来源不同的种[26];当荧光信号值低于5倍基底荧光信号强度时则认为是背景噪声,其对应的长度片段舍弃不用[27];所得数据为大于等于300 bp的ARISA片段[26]。利用PRIMER 6.0软件包中的非计量多维尺度转换排序(NMDS)工具对所有位点蓝细菌群落结构进行排序[28]。
1.4.4 构建克隆文库:根据ARISA片段排序结果,选取3个低、中、高盐度的代表站位(BR01、DR01和DR02)进行16S rRNA基因克隆文库的构建。PCR引物为CYA359F (5′-GCGGTAATTCCAGCTCCAA-3′)和CYA781R (5′-GACTACWGGGGTATCTAATCCCW TT-3′)[29]。PCR反应体系与ARISA相同。扩增条件:95℃ 7 min;95℃ 1 min,62℃ 1 min,72℃ 2 min,35个循环;72℃ 10 min。
PCR产物切胶纯化后,利用Ins TA clone PCR Cloning Kit (Fermentas)载体试剂盒连接到载体上,然后转化到大肠杆菌DH5α中,涂平板,37℃培养12 h,每个克隆文库挑取100个阳性克隆子,利用限制性内切酶MspⅠ和HhaⅠ进行限制性片段长度多态性分型(RFLP),每个酶切类型挑取1−2个代表克隆菌株测序[生工生物工程(上海)股份有限公司]。测序结果已上传到NCBI数据库中,GenBank登录号为:KP100361−KP100398。
1.4.5 构建系统发育树:利用克隆文库所得蓝细菌16S rRNA基因一段422 bp左右长度的片段进行系统发育分析。利用Bellerophon工具检测Chimera[30],去除嵌合体序列。利用DOTUR软件[31]进行OTU划分,域值设为98%;所得OTU通过Greengene数据库搜索相似序列,应用MAFFT version 7在线工具比对序列[32]。利用Jukes-Cantor模型计算遗传距离,选择连接法在MEGA 5.05中构建系统进化树[33]。
1.4.6 荧光定量PCR (qPCR):采用绝对定量PCR,通过SYBR GreenⅠ染料法测定蓝细菌16S rRNA基因拷贝数。利用特异性引物CYA359F和CYA781R[29]进行PCR扩增,获得约422 bp的基因片段。反应体系[34]:Maxima SYBR Green PCR/RoxqPCR Master Mix 10µL,正反向引物(10 μmol/L)各1µL,模板DNA 1µL,去离子水补足至20µL。每个样品设3次重复,并设不加模板的反应管为阴性对照。利用包含蓝细菌16S rRNA基因片段的质粒稀释至107−102拷贝数来构建标准曲线。扩增条件为:95℃ 7 min;95℃ 1 min,62℃ 1 min,40个循环。最后按照ABI 7500 Fast实时荧光定量检测系统默认程序制备熔解曲线:95℃ 15 s,60℃ 1 min,95℃ 30 s,60℃ 15 s,检测是否存在非特异性扩增。所有PCR反应的扩增效率均在90%以上,相关系数(R2)均大于98%。
1.4.7 数据处理与统计分析:基于ARISA提供的数据,计算丰富度(S)、香农指数(H')、与均匀度指数(E),S定义为样品ITS片段总数,香农指数(H')和均匀度指数(E)的计算公式分别为:H'=−Σ(Pi×lnPi);E=H'/lnS,其中Pi为第i条带净荧光信号强度与该群落所有条带的净荧光信号强度总和的比率。利用PRIMER 6.0软件包中的ANOSIM检验分析盐度梯度及含水量对蓝细菌群落结构的影响,BEST工具分析影响蓝细菌群落结构与理化因子的相关性[28]。利用SPSS统计软件中的单因子方差分析(ANOVA)检验样品间蓝细菌群落多样性的差异,t检验不同盐度梯度蓝细菌丰度的差异。
2 结果与分析 2.1 土壤理化因子获得的12个站位土样理化性质如表1所示。氨氮(0.04−0.29 mg/kg)、硝态氮(0.31−4.84 mg/kg)含量较低,总有机碳和有机氮含量最高也仅为13.87±3.48 g/kg和3.79±0.81 g/kg。pH呈弱碱性(7.10−7.93),总体沿入海方向呈降低趋势,盐度沿入海方向逐渐升高。盐度和含水量各样点间差异较大。按盐度范围样品定义为低(0.63%−1.27%)、中(1.55%−2.00%)、高(2.39%−5.11%)3个梯度;按照含水量分为3个梯度:低含水量(6.68%−18.72%),中含水量(21.93%−23.03%)和高含水量(23.11%−25.67%)。
| 站位 Site ID |
坐标Coordinates | 氨氮 NH 4 +-N (mg/kg) |
亚硝态氮 NO 2 −-N (mg/kg) |
硝态氮 NO 3 −-N (mg/kg) |
总有机氮 TON (g/kg) |
总有机碳 TOC (g/kg) |
pH | 盐度 Salinity (%) |
含水量 Water content (%) |
|
| 纬度E (°) | 经度N (°) | |||||||||
| YR01 | 37.772 9 | 119.161 5 | 0.14±0.02 | 0.83±0.01 | 2.96±0.14 | 1.35±0.20 | 8.28±0.10 | 7.34±0.10 | 2.39±0.09 | 22.79±0.50 |
| YR02 | 37.766 6 | 119.162 4 | 0.09±0.01 | 0.50±0.05 | 0.96±0.02 | 0.90±0.18 | 5.02±0.49 | 7.86±0.05 | 5.11±0.05 | 6.68±1.88 |
| YR03 | 37.764 9 | 119.162 9 | 0.09±0.02 | 0.48±0.04 | 1.03±0.13 | 0.81±0.03 | 4.82±0.39 | 7.62±0.03 | 3.47±0.16 | 22.17±1.04 |
| YR04 | 37.764 2 | 119.162 9 | 0.12±0.02 | 0.84±0.02 | 4.84±0.01 | 1.31±0.16 | 8.40±0.21 | 7.26±0.02 | 1.25±0.19 | 24.98±0.59 |
| BR01 | 37.011 2 | 119.157 8 | 0.06±0.02 | 0.42±0.02 | 0.55±0.04 | 0.59±0.16 | 4.23±0.19 | 7.93±0.23 | 1.61±0.11 | 21.93±1.00 |
| BR02 | 37.072 9 | 119.165 9 | 0.04±0.00 | 0.46±0.09 | 0.60±0.07 | 0.43±0.01 | 4.55±0.87 | 7.61±0.10 | 2.00±0.11 | 23.11±0.76 |
| DR01 | 36.979 8 | 119.342 3 | 0.06±0.00 | 0.43±0.01 | 0.91±0.10 | 0.55±0.05 | 4.27±0.13 | 7.52±0.14 | 0.63±0.01 | 25.67±1.39 |
| DR02 | 37.029 4 | 119.337 3 | 0.10±0.00 | 0.75±0.09 | 0.37±0.06 | 0.98±0.05 | 7.46±0.90 | 7.29±0.11 | 4.74±0.01 | 17.99±2.64 |
| JR01 | 36.930 6 | 119.591 7 | 0.09±0.02 | 0.86±0.07 | 0.31±0.05 | 0.88±0.23 | 8.59±0.66 | 7.46±0.11 | 0.70±0.01 | 24.86±2.10 |
| JR02 | 36.968 1 | 119.586 9 | 0.29±0.08 | 1.39±0.35 | 0.74±0.15 | 3.79±0.81 | 13.87±3.48 | 7.10±0.12 | 1.27±0.13 | 17.57±0.78 |
| JR03 | 37.052 1 | 119.564 9 | 0.08±0.02 | 0.33±0.04 | 2.21±0.09 | 0.77±0.17 | 3.32±0.02 | 7.15±0.11 | 1.55±0.18 | 18.72±0.38 |
| JR04 | 37.083 0 | 119.549 6 | 0.06±0.01 | 0.38±0.05 | 0.53±0.03 | 0.55±0.09 | 3.79±0.24 | 7.40±0.23 | 1.64±0.04 | 23.03±0.25 |
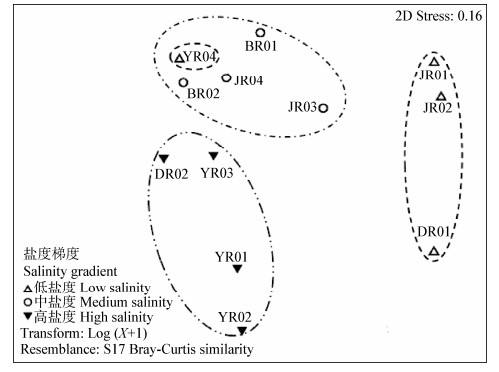
蓝细菌群落的NMDS排序结果(图2)表明,所有站位基本可按盐度梯度分为高、中、低盐度三大组群。BEST分析结果显示,盐度和含水量这两个因子的组合对蓝细菌群落结构影响最大(ρ=0.569,P=0.02,表2)。将所有位点按盐度与含水量梯度分组,ANOSIM检验发现,盐度(P=0.03)对蓝细菌群落结构有显著影响,而含水量对蓝细菌群落结构影响并不显著(P=0.09);其中,中、高盐度样品间蓝细菌群落结构差异最大(R=0.47,P=0.03,表3)。

|
|
图 2
基于ARISA的蓝细菌群落结构非度量多维尺度排序
Figure.2
NMDS ordination based on Bray-Curtis similarities of cyanobacterial ARISA fingerprints
注:虚线圈表示不同盐度样品间的蓝细菌群落结构区别明显. Note:Dashed lines indicate the community structure of cyanobacteria in soils of different salinity ranges. |
| 排名Rank | ρ | 环境变量environmental variables |
| 1 | 0.569 | 盐度(Salinity),含水量(Water content) |
| 2 | 0.566 | 盐度(Salinity),含水量(Water content),亚硝态氮(NO 2 −-N) |
| 3 | 0.558 | 盐度(Salinity),含水量(Water content),氨氮(NH 4 +-N) |
| 4 | 0.539 | 盐度(Salinity),含水量(Water content),总有机碳(TOC) |
| 5 | 0.534 | 盐度(Salinity),含水量(Water content),氨氮(NH 4 +-N),亚硝态氮(NO 2 −-N) |
| 6 | 0.533 | 盐度(Salinity),含水量(Water content),氨氮(NH 4 +-N),总有机碳(TOC) |
Note:P-values in bold indicate significant differences (P<0.05).
| 分组Grouping | R | P |
| 盐度梯度salinity gradient | 0.26 | 0.03 |
| 低盐vs.中盐Low saline vs.Medium saline | 0.15 | 0.20 |
| 低盐vs.高盐Low saline vs.High saline | 0.26 | 0.11 |
| 中盐vs.高盐Medium saline vs.High saline | 0.47 | 0.03 |
| 水含量water content | 0.61 | 0.09 |
| 低水vs.中水Low water vs.Medium water | 0.33 | 0.06 |
| 低水vs.高水Low water vs.High water | −0.06 | 0.20 |
| 中水vs.高水Medium water vs.High water | 0.57 | 0.57 |
利用单因子方差分析对蓝细菌ARISA群落结构多样性(丰富度S、均匀度E以及香农指数H')进行评估。结果显示,不同含水量样品间蓝细菌多样性差别不大(P>0.05);盐度对蓝细菌群落丰富度具有显著影响(P=0.04),低盐样品蓝细菌的丰富度显著低于中、高盐样品(表4)。
| 样品分组 Sample grouping |
香农指数H' Shannon index |
丰富度S Richness |
均匀度E Evenness |
| 盐度Salinity gradient | |||
| 低盐Low saline | 2.00±0.29 | 12.25±1.26 | 0.80±0.09 |
| 中盐Medium saline | 2.41±0.15 | 16.75±2.75 | 0.86±0.01 |
| 高盐High saline | 2.35±0.32 | 17.00±2.94 | 0.83±0.08 |
| P值P-value | 0.12 | 0.04 | 0.51 |
| 水含量Water content | |||
| 低水Low water | 2.22±0.04 | 13.00±1.41 | 0.87±0.02 |
| 中水Medium water | 2.31±0.32 | 16.43±3.21 | 0.83±0.07 |
| 高水High water | 2.16±0.42 | 14.33±3.51 | 0.81±0.09 |
| P值P-value | 0.80 | 0.36 | 0.70 |
Note:P-value in bold indicates significant difference (P<0.05)..Values of diversity estimators are provided as means and standard errors.
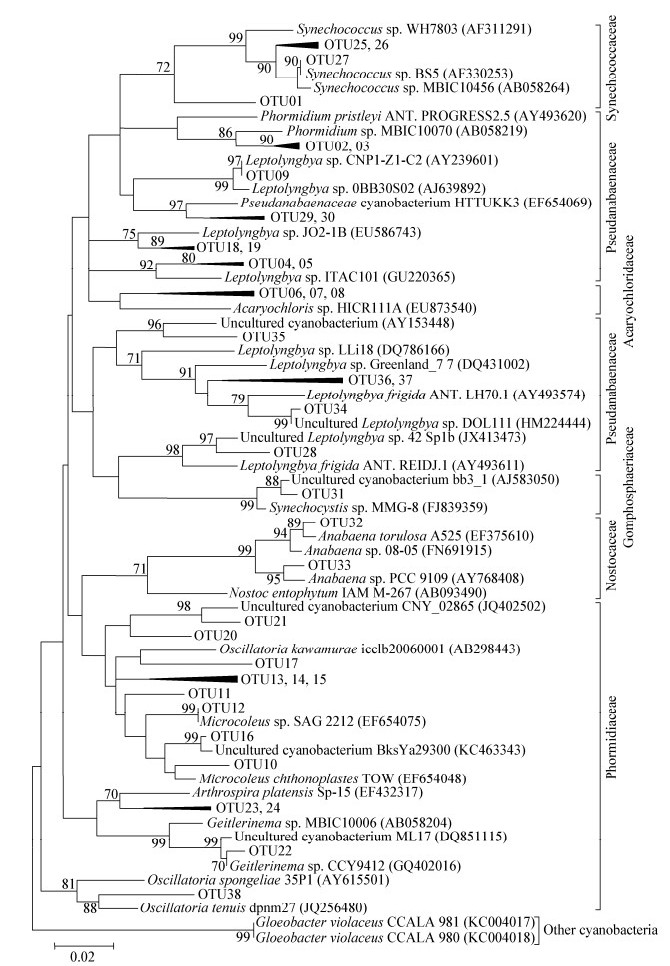
高、中、低盐度3个代表样品构建蓝细菌16S rRNA基因克隆文库,测序共获得266条序列,其中低盐区91条,中盐区90条,高盐区85条。共划分为38个OTU,其在系统发育树中的系统归属见图3。获得的OTU可归类到蓝细菌门中的9个属与2个未知类群,分别为Pseudanabaenaceae科的Halomicronema、Phormidium、Leptolyngbya属;Synechococcaceae科的Prochlorococcus属;Acaryochloridaceae科的Acaryochloris属;Phormidiaceae科的Geitlerinema、Arthrospira、Oscillatoria、Microcoleus属;以及隶属于Gomphosphaeriaceae科的Unclassified-1类群及Nostocaceae科的Unclassified-2类群。

|
|
图 3
蓝细菌16S rRNA基因系统发育树,展示新获得的38个OTU的科级系统归属
Figure.3
A Neighbor-Joining tree of 16S rRNA gene showing the phylogenetic placements at family level of 38 cyanobacterial OTUs obtained from this study
注:刻度0.02代表该长度下的进化距离,分支点处仅显示大于70%的节点值. Note:The scale bar represents an estimated 2% divergence,nodal bootstrap values>70% are shown. |
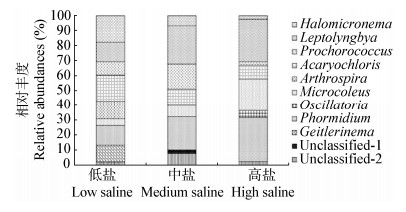
从蓝细菌群落组成上可以看出(图4),在低盐区,Halomicronema和Acaryochloris为优势类群,其相对丰度占到17.58%,其中Oscillatoriales目的Arthrospira和Geitlerinema属仅在低盐区发现,相对丰度为23.08%。在中、高盐区,Leptolyngbya属占优势,相对丰度分别达到25.56%和28.24%。未分类蓝细菌主要存在于中盐区,其中Gomphosphaeriaceae科的未知类群unclassified-1相对丰度为2.22%;未知类群unclassified-2在每个盐度梯度下均有发现,相对丰度从2.20%到7.78%不等。Halomicronema和Acaryochloris属随盐度升高,相对丰度逐渐下降,而Leptolyngbya、Microcoleus和Phormidium属则随盐度升高相对丰度逐渐增加。

|
| 图 4 不同盐度范围土壤样品中蓝细菌各亚类群相对丰度的比较 Figure.4 Relative abundances of cyanobacterial genera in communities along the salinity gradient |
荧光定量PCR结果显示,蓝细菌16S rRNA基因在JR02位点的拷贝数最高,达到2.70×10⁵ copies/g干土;在YR03位点的拷贝数最低,仅为3.36×103 copies/g干土。蓝细菌16S rRNA基因拷贝数随盐度的升高而降低,低盐区平均值为2.14×10⁵ copies/g干土,中盐度为1.25×105 copies/g干土,而高盐区仅为1.20×105 copies/g干土。t检验发现,低盐与中盐样品间蓝细菌16S rRNA基因拷贝数差异显著(P=0.02),低盐与高盐度差异接近显著(P=0.08),但中、高盐样品间差异不大(P=0.46,图5)。

|
|
图 5
不同盐度土壤中蓝细菌16S rRNA基因拷贝数的比较
Figure.5
Copy numbers of cyanobacterial 16S rRNA gene in salinity-gradient soils
注:误差线代表标准误差;低盐组丰度显著高于中盐组(P=0.02),而其他组间丰度则不显著(P>0.05). Note:The vertical bars represent standard errors;significant differences are found between low and medium saline soil samples (P=0.02),but not for other gradients (P>0.05). |
此前许多研究表明,在盐碱土壤环境中,细菌的多样性及丰富度主要受土壤pH的影响[35,36]。而Rigonato等对湿地红树林的研究证明,盐度梯度上蓝细菌的群落组成和分布差异显著[16]。通过我们的研究发现,莱州湾南部土壤盐度整体由沿海向内陆递减,近岸样点由于受海水入侵影响强烈,土壤盐渍化程度较高,盐度约为2.39%−5.11%,而内陆样点盐渍化程度较低,盐度仅为0.63%−1.27%。蓝细菌群落组成与分布主要与土壤盐度和含水量有关,其中盐度作为主要影响因子,对蓝细菌的群落有较大的影响,蓝细菌群落多样性以及丰富度随着盐度的升高而逐渐升高。土壤含水量由于可以间接影响土壤盐度,进而对生物群落产生一定的影响[37,38]。
3.2 蓝细菌在不同盐度梯度土壤中的群落组成和分布ARISA已被证实是一种快速高效的探究微生物群落结构与丰度的有效手段[39],本研究在单一盐度梯度土壤中就发现了多达44个长度不同的ITS片段,说明该环境中存在丰富的蓝细菌。通过将克隆建库所得序列与Greengenes数据库对比,并结合系统发育树结果,共鉴定发现蓝细菌9个属和2个未知属,其中未知蓝细菌序列的发现暗示着一些潜在的新型蓝细菌的存在。
本研究发现,随着盐度的升高,蓝细菌种群多样性逐渐增加,且群落组成在不同盐度梯度间差异较大。一些常见的耐盐类群Leptolyngbya、Phormidium以及Microcoleus属随盐度的增加,比例逐渐升高。Leptolyngbya属被证实是一种可以在条件苛刻环境下进行光能固氮的蓝细菌类群[40];Phormidium属在高盐环境中具有较强的适应性,有研究发现其在盐湖中广泛存在[41];而且Cuddy等通过实验发现,Leptolyngbya属以及Microcoleus属等类群能够在盐度胁迫环境中利用胞外多糖等吸附土壤养分,进而对土壤的营养保持起到一定的作用[42]。因此,这些种属在高盐区占优势与其生态功能和耐盐性密切相关,可能成为修复盐渍土的重要参考资源。蓝细菌Prochlorococcus和Synechococcus属在许多滨海盐渍土中都有发现且丰度很高[16],在莱州湾南岸盐渍土中比例却较低甚至没有检测到,可能是因为地理距离和土壤环境的差异。
3.3 蓝细菌丰度对盐度梯度的响应Rinta-Kanto等在美国伊利湖利用蓝细菌Microcystis属特异性16S rRNA基因定量检测发现,其丰度达2×10³−4×10⁸个/L[43]。Yeager等研究干旱草原表层土中微生物固氮基因发现,98%以上的nifH固氮基因来自于蓝细菌,其拷贝数达每克土3×106−1×108个[44]。本研究利用蓝细菌通用16S rRNA基因引物检测其丰度,发现平均每克土中蓝细菌16S rRNA基因拷贝数在3.36×10³−2.70×10⁵之间,说明虽然该环境蓝细菌的多样性较高,但其丰度却相对较低。Li等对新疆荒漠表层土蓝细菌的定量研究发现,低盐土壤中蓝细菌Microcoleusvagnitus为优势类群,但随着盐度升高,丰度逐渐降低,而其他耐盐菌的相对丰度逐渐升高[45]。我们的结果也证实滨海盐渍土蓝细菌随着盐度升高,物种逐渐演替为耐盐种占优势,然而从总细胞丰度来看,高盐影响蓝细菌丰度,低盐区显著高于中、高盐区。综上研究可以发现,由于盐度对群落中优势类群的抑制作用,导致其实际丰度及在群落中的相对丰度均降低,而低丰度种类可能对盐度的变化不敏感,最终表现为总丰度降低但物种丰富度增高。
总体来看,本工作指出了盐渍化土壤系统中蓝细菌的空间分布规律,而前人研究指出时间尺度也对蓝细菌的生物量以及群落组成有决定性影响[46,47]。盐渍化背景下时间与空间对土壤蓝细菌的相对重要性仍需进一步研究,相关研究成果可能为揭示盐渍化土壤系统微生物驱动的地球化学循环及滨海盐渍土壤的修复与利用提供支撑。
4 结论由于蓝细菌在土壤固氮、固碳功能中占有重要地位,对盐渍化土壤中蓝细菌多样性与分布规律的认识有助于进一步理解此环境碳氮循环的微生物学机制。本研究结果说明蓝细菌在滨海盐渍化土壤中广泛分布,多样性较高;随着盐渍化程度的加重,蓝细菌丰富度增高而丰度降低,优势类群也发生明显的演替。盐渍化程度是调控莱州湾南岸滨海土壤中蓝细菌群落结构与丰度的最重要环境因子,可能对滨海土壤微生物碳氮循环产生重要影响。
| [1] | Gong J,Song YJ,Zhang XL.Phylogenetic and functional diversity of nitrogen cycling microbes in coastal sediments[J].Biodiversity Science,2013,21(4):433-444(in Chinese)龚骏,宋延静,张晓黎.海岸带沉积物中氮循环功能微生物多样性[J].生物多样性,2013,21(4):433-444 |
| [2] | Gong J,Zhang XL.Contribution and mechanism of microbe-driving nitrogen cycling processes in coastal ecosystems[J].Microbiology China,2013,40(1):44-58(in Chinese)龚骏,张晓黎.微生物在近海氮循环过程的贡献与驱动机制[J].微生物学通报,2013,40(1):44-58 |
| [3] | Dominik JP,Ladislav H,Thomas F,et al.Biodiversity of soil cyanobacteria in the hyper-arid Atacama Desert,Chile[J].Journal of Phycology,2014,50(4):698-710 |
| [4] | Wood SA,Mountfort D,Selwood AI,et al.Widespread distribution and identification of eight novel microcystins in Antarctic cyanobacterial mats[J].Applied and Environmental Microbiology,2008,74(23):7243-7251 |
| [5] | Asunción DLR,Cary C,Vincent CD.The spatial structures of hypolithic communities in the Dry Valleys of east Antarctica[J].Polar Biology,2014,37(12):1823-1833 |
| [6] | Giovanni C,Hua LB,Federico R,et al.Microbial secreted exopolysaccharides affect the hydrological behavior of induced biological soil crusts in desert sandy soils[J].Soil Biology and Biochemistry,2014,68:62-70 |
| [7] | Philippis RD,Margheri MC,Materassir R,et al.Potential of unicellular cyanobacteria from saline environments as exopolysaccharide producers[J].Applied and Environmental Microbiology,1998,64(3):1130-1132 |
| [8] | Sahlan O,Belma A,Zekiye S,et al.Metal removal of cyanobacterial exopolysaccharides by uronic acid content and monosaccharide composition[J].Carbohydrate Polymers,2014,101(30):265-271 |
| [9] | Lozupone CA,Rob K.Global patterns in bacterial diversity[J].Proceedings of the National Academy of Sciences of the United States of America,2007,104(27):1436-1440 |
| [10] | Bernhard AE,Donn T,Anne E,et al.Loss of diversity of ammonia-oxidizing bacteria correlates with increasing salinity in an estuary system[J].Environmental Microbiology,2005,7(9):1289-1297 |
| [11] | Mohamed DJ,Martiny JBH.Patterns of fungal diversity and composition along a salinity gradient[J].International Society for Microbial Ecology,2011,5(3):379-388 |
| [12] | Garcia-Pichel F,Nübel U,Muyzer G.The phylogeny of unicellular,extremely halotolerant cyanobacteria[J].Archives of Microbiology,1998,169(2):469-482 |
| [13] | H?usler S,Weber M,Beer D,et al.Spatial distribution of diatom and cyanobacterial mats in the Dead Sea is determined by response to rapid salinity fluctuations[J].Extremophiles,2014,18(6):1085-1094 |
| [14] | Green SJ,Blackford C,Bucki P,et al.A salinity and sulfate manipulation of hypersaline microbial mats reveals stasis in the cyanobacterial community structure[J].International Society for Microbial Ecology,2008,2(5):457-470 |
| [15] | Yannarell AC,Steppe TF,Paerl HW.Genetic variance in the composition of two functional groups (diazotrophs and cyanobacteria) from a hypersaline microbial mat[J].Applied and Environmental Microbiology,2006,72(2):1207-1217 |
| [16] | Rigonato J,Kent AD,Alvarenga DO,et al.Drivers of cyanobacterial diversity and community composition in mangrove soils in south-east Brazil[J].Environmental Microbiology,2013,15(4):1103-1114 |
| [17] | Shi Y,Sun HB,Liu YQ,et al.Vertical distribution of bacterial community in sediments of freshwater lake Puma Yumco and saline lake AWongco on the Tibetan Plateau[J].Microbiology China,2014,41(11):2379-2387(in Chinese)时玉,孙怀博,刘勇勤,等.青藏高原淡水湖普莫雍错和盐水湖阿翁错湖底沉积物中细菌群落的垂直分布[J].微生物学通报,2014,41(11):2379-2387 |
| [18] | Meng GL,Han YS,Wang SP.Types and district divisions of seawater intrusion concerning southern coast of Laizhou Bay[J].Journal of Oceanography,1997,15(2):25-32 |
| [19] | Wu JC,Xue YQ,Liu PM,et al.Sea-water intrusion in the coastal area of Laizhou Bay,China:2.sea-water intrusion monitoring[J].Ground Water,1993,31(5):740-745 |
| [20] | Xue YQ,Wu JC,Ye SJ,et al.Hydrogeological and hydrogeochemical studies for salt water intrusion on the south coast of Laizhou Bay,China[J].Ground Water,2000,38(1):38-45 |
| [21] | Freitag TE,Prosser CL.Changes of hydrological environment and their influences on coastal wetlands in the southern Laizhou Bay,China[J].Environmental Monitoring and Assessment,2006,119(1/3):97-106 |
| [22] | Wu JC,Xue YQ,Liu PM,et al.Sea-water intrusion in the coastal area of Laizhou Bay,China:1.distribution of sea-water intrusion and its hydrochemical characteristics[J].Ground Water,1993,31(4):532-537 |
| [23] | Hanahan D.Studies on transformation of Escherichia coli with plasmids[J].Journal of Molecular Biology,1983,166(4):557-580 |
| [24] | Guo XH,Gong J.Differential effects of abiotic factors and host plant traitson diversity and community composition of root-colonizing arbuscular mycorrhizal fungi in a salt-stressed ecosystem[J].Mycorrhiza,2014,24(2):79-94 |
| [25] | Gardner,KH.Water content[J].Methods of soil analysis.Part 1.Physical and mineralogical methods,1986,493-544 |
| [26] | Wood SA,Rueckert A,Cowan DA,et al.Sources of edaphic cyanobacterial diversity in the dry valleys of eastern Antarctica[J].International Society for Microbial Ecology,2008,2(3):308-320 |
| [27] | Hewson I,Vargo GA,Fuhrman JA.Bacterial diversity in shallow oligotrophic marine benthos and overlying waters:effects of virus infection,containment,and nutrient enrichment[J].Microbial Ecology,2003,46(3):322-336 |
| [28] | Clarke KR,Gorley RN.Primer V6 User Manual Tutorial[D].Plymouth:Primer-E Ltd,2006:190 |
| [29] | Nübel U,Garcia-Pichel F,Muyzer G.PCR primers to amplify 16S rRNA genes from cyanobacteria[J].Applied and Environmental Microbiology,1997,63(8):3327-3332 |
| [30] | Huber T,Faulkner G,Hugenholtz P.Bellerophon:a program to detect chimeric sequences in multiple sequence alignments[J].Bioinformatics,2004,20(14):2317-2319 |
| [31] | Schloss PD,Handelsman J.Introducing DOTUR,a computer program for defining operational taxonomic units and estimating species richness[J].Applied and Environmental Microbiology,2005,71(3):1501-1506 |
| [32] | Katoh K,Standley DM.MAFFT multiple sequence alignment software version 7:improvements in performance and usability[J].Molecular Biology and Evolution,2013,30(4):772-780 |
| [33] | Tamura K,Peterson D,Peterson N,et al.MEGA5:molecular evolutionary genetics analysis using maximum likelihood,evolutionary distance,and maximum parsimony methods[J].Molecular Biology and Evolution,2011,28(10):2731-2739 |
| [34] | Zhang XL,Agogué H,Dupuy C,et al.Relative abundance of ammonia oxidizers,denitrifiers,and anammoxbacteria in sediments of hyper-nutrified estuarine tidal flats and in relation to environmental conditions[J].CLEAN-Soil,Air,Water,2014,42(6):815-823 |
| [35] | Fierer N,Jackson RB.The diversity and biogeography of soil bacterial communities[J].Proceedings of the National Academy of Sciences of the United States of America,2006,103(3):626-631 |
| [36] | Xiong JB,Liu YQ,Zeng J,et al.Geographic distance and pH drive bacterial distribution in alkaline lake sediments across Tibetan Plateau[J].Environmental Microbiology,2012,14(9):2457-2466 |
| [37] | Hershkovitz N,Oren A,Cohen Y.Accumulation of trehalose and sucrose in cyanobacteria exposed to matric water stress[J].Applied and Environmental Microbiology,1991,57(3):645-648 |
| [38] | Potts M.Mechanisms of desiccation tolerance in cyanobacteria[J].European Journal of Phycology,1999,34(4):319-328 |
| [39] | Fisher MM,Triplett EW.Automated approach for ribosomal intergenic spacer analysis of microbial diversity and its application to freshwater bacterial communities[J].Applied and Environmental Microbiology,1999,65(10):4630-4636 |
| [40] | Myers JL,Sekar R,Richardson LL.Molecular detection and ecological significance of the cyanobacterial genera Geitlerinema and Leptolyngbya in black band disease of corals[J].Applied and Environmental Microbiology,2007,73(16):5173-5182 |
| [41] | Tsyrenova DD,Bryanskaya AV,Namsaraev ZB,et al.Taxonomic and ecological characterization of cyanobacteria from some brackish and saline lakes of Southern Transbaikal Region[J].Microbiology,2011,80(2):216-227 |
| [42] | Cuddy WS,Summerell BR,Gehringer MM,et al.Nostoc,Microcoleus and Leptolyngbya inoculums are detrimental to the growth of wheat (Triticumaestivum L.) under salt stress[J].Plant and Soil,2013,370(1/2):317-332 |
| [43] | Rinta-Kanto JM,Ouellette AJA,Twiss MR,et al.Quantification of toxic Microcystis sp.during the 2003 and 2004 blooms in western Lake Erie using quantitative real-time PCR[J].Environmental Science and Technology,2005,39(11):4198-4205 |
| [44] | Yeager CM,Kuske CR,Carney TD,et al.Response of biological soil crust diazotrophs to season,altered summer precipitation,and year-round increased temperature in an arid grassland of the colorado plateau,USA[J].Front Microbiology,2012,3:358 |
| [45] | Li K,Liu R,Zhang H,et al.The diversity and abundance of bacteria and oxygenic phototrophs in saline biological desert crusts in Xinjiang,northwest China[J].Microbial Ecology,2013,66(1):40-48 |
| [46] | Briand E,Gugger M,Francois JC,et al.Temporal variations in the dynamics of potentially microcystin-producing strains in a bloom-forming Planktothrix agardhii (cyanobacterium) population[J].Applied and Environmental Microbiology,2008,74(12):3839-3848 |
| [47] | Thomas AD,Dougill AJ.Spatial and temporal distribution of cyanobacterial soil crusts in the Kalahari:implications for soil surface properties[J].Geomorphology,2007,85(1/2):17-29 |
 2015, Vol. 42


