中国科学院微生物研究所、中国微生物学会主办
文章信息
- 万辉辉, 刘振浩, 澹小秀, 王广志, 徐勇, 谢鹭, 林勇
- Huihui Wan, Zhenhao Liu, Xiaoxiu Tan, Guangzhi Wang, Yong Xu, Lu Xie, Yong Lin
- 免疫细胞浸润在非小细胞肺癌诊断与预后中的应用
- Application of immune cell infiltration in the diagnosis and prognosis of non-small cell lung cancer
- 生物工程学报, 2020, 36(4): 740-749
- Chinese Journal of Biotechnology, 2020, 36(4): 740-749
- 10.13345/j.cjb.190232
-
文章历史
- Received: June 4, 2019
- Accepted: September 9, 2019
2. 上海生物信息技术研究中心,上海 201203;
3. 中南大学湘雅医院,湖南 长沙 410008;
4. 上海海洋大学 食品科学与技术学院,上海 201306
2. Shanghai Center for Bioinformation Technology, Shanghai 201203, China;
3. Xiangya Hospital, Central South University, Changsha 410008, Hunan, China;
4. College of Food Science and Technology, Shanghai Ocean University, Shanghai 201306, China
肺癌是一种常见的恶性肿瘤,具有极高的发病率与死亡率[1]。据美国癌症协会和癌症统计中心统计,每年有超过15万肺癌患者死亡,同时每年新增确诊病例数约20万。肺癌主要有小细胞肺癌(Small cell lung cancer,SCLC)和非小细胞肺癌(Non-small cell lung cancer,NSCLC)两种组织学表型,NSCLC占所有肺癌病例85%左右[2]。而NSCLC主要分为肺腺癌(Lung adenocarcinoma,LUAD)和肺鳞癌(Lung squamous carcinoma,LUSC)[3]。
组织病理学切片图像的目视检查是病理学家评估肺癌肿瘤分期、类型和亚型的主要方法之一。NSCLC的诊断是一个关键的过程,因为传统的化疗以及最近的靶向治疗对LUAD和LUSC的治疗方案是不同的[4]。并且在缺乏明确的组织学特征的情况下,这一重要的诊断可能是具有挑战性和耗时性的。面对这样的挑战,许多研究人员对NSCLC诊断作出了不同的研究方案,如Yu等[5]将传统的阈值和图像处理技术与随机森林、支持向量机或朴素贝叶斯分类器等机器学习方法相结合,区分NSCLC肿瘤和正常组织AUC达到0.85,区分LUAD和LUSC组织AUC达到0.75。在区分NSCLC肿瘤和正常组织时,Girard等[6]以62种基因为特征采用最近距离法分类准确率达到86%,Du等[7]以STC1 mRNA为特征通过计算约登指数得到最佳截断点作分类AUC达到0.969。这些研究对NSCLC的诊断提供了新的方法,但是其诊断的效果还有较大的提升空间。
尽管近年来微创手术、化疗和靶向治疗等方法在NSCLC治疗中取得了进步,但患者的5年生存率远远不能令人满意,大多数地区的生存率在10%到20%之间[8]。而NSCLC的治疗决策和预后在很大程度上取决于TNM分期系统的评估[9]。目前有许多通过引入临床病理或其他特征来优化分期系统的方案被提出,如年龄、性别、肿瘤位置等[10],甚至包括基因表达信息[11-12]。最近,也有证据表明免疫细胞浸润对NSCLC的临床和预后的重要性,将免疫细胞浸润作为特征纳入预后模型有助于临床医生对患者的预后进行更可靠和准确的预测[13]。
Newman等开发出一种称为CIBERSORT的工具[14],它可以利用多种组织类型(包括实体肿瘤)的基因表达数据得到22种免疫细胞占比来评估免疫细胞浸润情况,同时在处理噪声、未知混合物含量和密切相关的细胞类型等方面都优于其他方法且通过流式细胞术得到很好的验证[15]。由于CIBERSORT优越的性能,研究人员使用CIBERSORT对各种癌症的免疫细胞浸润情况的研究越来越多[16-18]。本研究用CIBERSORT工具计算得到22种免疫细胞浸润情况,采用机器学习方法构建了以22种免疫细胞占比为特征的NSCLC肿瘤与正常组织的分类模型。同时采用LASSO回归建立了由8种免疫细胞组成的免疫细胞评分,免疫细胞评分结合临床特征构建了NSCLC预后模型。
1 材料与方法 1.1 实验数据2018年12月,从肿瘤基因组图谱数据库(The Cancer Genome Atlas,TCGA,https://cancergenome.nih.gov/)检索下载了1 007例NSCLC肿瘤组织基因表达数据和104例正常组织基因表达数据及对应样本的临床数据
从TCGA下载的基因表达数据,使用David工具[19]将ENSEMBL号转化为基因名(Gene Symbol),并且将相同基因号的表达数据取均值作为最终基因表达数据。下载的临床数据特征包括年龄、病理分期、T分期、N分期、M分期、性别、化疗情况、烟龄、随访日期、生存状况。对于生存资料缺失、随访日期缺失或小于一个月的临床数据进行剔除,然后与基因表达数据进行匹配,最后总共获得812例基因表达与临床资料都有的患者数据。
在研究中,使用1 007例NSCLC肿瘤组织基因表达数据(510例LUAD、497例LUSC)与104例正常组织基因表达数据构建NSCLC肿瘤与正常组织分类模型;使用812例基因表达与临床资料都有的NSCLC患者数据构建NSCLC预后模型。此外从基因表达综合数据库(Gene Expression Omnibus,GEO)下载了编号为GSE10245[20]非小细胞肺癌基因表达数据,用于对分类模型进行验证,其中40例LUAD、18例LUSC。
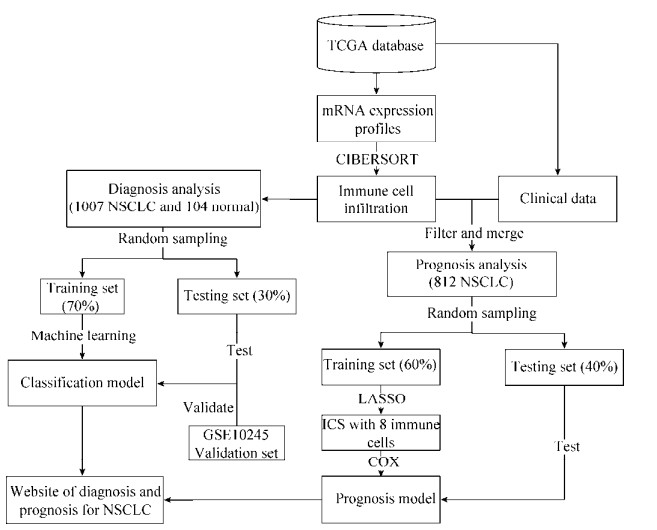
1.2 分析方法本研究中涉及所有分析均使用R软件(版本3.5.1)进行,NSCLC分类模型与预后模型构建的方法流程如图 1所示。首先用CIBERSORT工具评估NSCLC肿瘤组织与正常组织的免疫细胞浸润水平,然后用机器学习方法构建NSCLC分类模型,用LASSO回归构建由8种免疫细胞组成的免疫细胞评分结合临床特征用COX回归构建NSCLC预后模型。

|
| 图 1 NSCLC分类模型与预后模型构建方法流程图 Fig. 1 Flow chart of methods of constructing classification model and prognosis model of NSCLC. |
| |
(1) 评估免疫细胞浸润水平方法
CIBERSORT工具提供了线下用R语言编写的脚本,通过加载提供的包即可使用。CIBERSORT采用了线性支持向量回归方法,这是一种对噪声具有高度鲁棒性的机器学习方法[21],可对包括B细胞、T细胞、自然杀伤细胞、巨噬细胞、树突状细胞和骨髓亚群细胞等在内的22种免疫细胞表型进行高度敏感性和特异性识别,22种免疫细胞类型名称详细信息如表 1所示。在每个样本中,22种免疫细胞占比分数之和等于1,用这22种免疫细胞的占比分数来评估浸润水平。
| 22 immune cells | ||
| B cells naive | T cells regulatory | Dendritic cells resting |
| B cells memory | T cells gamma delta | Dendritic cells activated |
| Plasma cells | NK cells resting | Mast cells resting |
| T cells CD8 | NK cells activated | Mast cells activated |
| T cells CD4 naive | Monocytes | Eosinophils |
| T cells CD4 memory resting | Macrophages M0 | Neutrophils |
| T cells CD4 memory activated | Macrophages M1 | |
| T cells follicular helper | Macrophages M2 | |
(2) 机器学习与LASSO回归方法
分类模型采用的机器学习方法用R包‘caret’实现,其中‘train’函数设置参数可以选择所使用的方法,本研究中用到4种机器学习方法:神经网络、随机森林、贝叶斯广义线性模型和最小二乘回归。对于随机森林,它会为每个特征计算出准确度平均降低量(Mean Decrease Accuracy)和基尼指数平均降低量(Mean Decrease Gini),这两个值都是对特征评估的重要性指标,同时随机森林对于其他机器学习方法的优势在于可以评估所有特征的重要性从而对特征进行筛选[22]。
LASSO回归通过构造一个惩罚函数得到一个较为精练的模型,从而压缩一些回归系数,同时设定一些回归系数为零[23]。本研究使用R包‘glmnet’通过十折交叉验证选取误差最小的惩罚参数λ,来选择22种免疫细胞中最为有效的预后标记免疫细胞子集及其对应的回归系数构建免疫细胞评分。
(3) 模型性能评估方法
分类模型中均用随机抽样将数据7︰3划分为训练集与测试集,采用十折交叉进行验证且重复3次。用分类准确率(Accuracy)和ROC曲线下面积(AUC)等来评估分类模型性能。Accuracy和AUC越大,表示分类模型性能越好。准确率是分类结果正确的样本数与总样本数的比值,公式为:
| $ {\rm{Accuracy = }}\frac{{TP + TN}}{{FP + FN + TP + TN}} $ |
其中,TP=true positive;TN=true negative;FP=false positive;FN=false negative;
预后模型中用分层随机抽样将数据6︰4划分为训练集和测试集。COX单因素分析用于计算变量的风险比。筛选COX单因素分析中P < 0.05的变量纳入COX多因素分析。采用Kaplan-Meier曲线分析变量与总体生存率的关系,并且用log-rank检验显著性水平。用COX多因素分析并采用后退法筛选变量建立NSCLC预后模型。用C-index (Harrell’s concordance index)来评估预后模型性能,并采用1 000次bootstrap抽样方法进行验证。C-index大于0.7表示预后模型稳定,值越高性能越好。同时,用3年和5年校准曲线对预后模型性能进行评估,校准曲线越趋近对角线表示性能越好。
2 结果与分析 2.1 NSCLC分类模型分类结果基于机器学习的4种方法,以22种免疫细胞占比为特征,构建了NSCLC肿瘤组织与正常组织分类的模型。四种方法构建的模型均显示了良好的分类效果(图 2A),从表 2的分类结果中可以看出随机森林方法效果最好,AUC=0.987、敏感性0.98及特异性0.84。同样以22种免疫细胞占比为特征,基于机器学习的4种方法,我们构建了LUAD、LUSC肿瘤组织的二分类模型(图 2B)。模型分类结果如表 3所示,随机森林方法构建的模型整体效果最好,AUC=0.827、敏感性0.75及特异性0.77。此外,我们用GEO数据库中编号为GSE10245的数据对随机森林方法建立的分类模型进行验证,58例数据在NSCLC肿瘤与正常组织分类模型中验证准确率为100%,在LUAD和LUSC肿瘤组织分类模型中验证AUC=0.753、敏感性0.68及特异性0.78 (图 2C)。

|
| 图 2 机器学习构建分类模型的ROC曲线图 Fig. 2 ROC curve of classification model by machine learning. Four machine learning methods: nnet-neural network, rf-random forest, bayesglm-bayesian generalized linear model, simpls-partial least squares. (A) ROC curves of classification model of NSCLC tissues and normal tissues constructed by four machine learning methods. (B) ROC curves of classification model of LUAD and LUSC tissues constructed by four machine learning methods. (C) The ROC curves verified by GSE10245 in LUAD and LUSC tissues classification model constructed by random forest method. |
| |
| Model | AUC | Accuracy (95% CI) |
Sensitivity | Specificity |
| nnet | 0.965 | 0.964 1 (0.938 1, 0.981 3) |
0.973 5 | 0.875 0 |
| rf | 0.987 | 0.967 1 (0.941 8, 0.983 4) |
0.980 1 | 0.843 8 |
| Bayesglm | 0.967 | 0.967 1 (0.941 8, 0.983 4) |
0.976 8 | 0.875 0 |
| Simpls | 0.978 | 0.940 1 (0.909 0, 0.963 0) |
0.983 4 | 0.531 2 |
| Model | AUC | Accuracy (95% CI) |
Sensitivity | Specificity |
| nnet | 0.818 | 0.734 6 (0.681 7, 0.783 0) |
0.773 6 | 0.693 3 |
| rf | 0.827 | 0.760 5 (0.708 9, 0.807 0) |
0.754 7 | 0.766 7 |
| Bayesglm | 0.819 | 0.744 3 (0.691 9, 0.792 0) |
0.773 6 | 0.713 3 |
| Simpls | 0.792 | 0.689 3 (0.634 5, 0.740 5) |
0.723 3 | 0.653 3 |
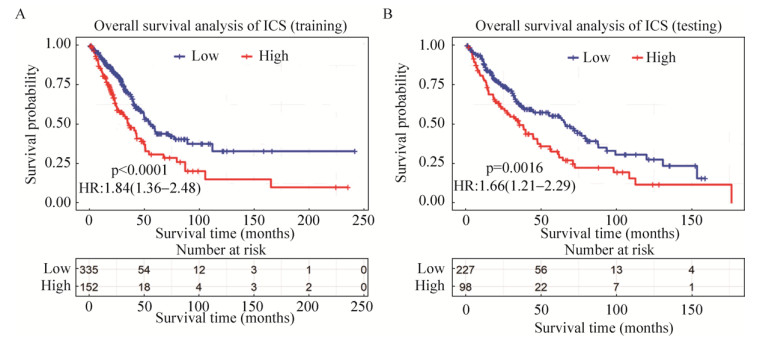
研究中训练集采用LASSO回归分析选择22种免疫细胞中最为有效的预后标记免疫细胞子集及其对应的回归系数构建免疫细胞评分(Immunocyte score,ICS),通过十折交叉验证后,当惩罚参数λ=0.022时,误差达到最小,由此得到8个特征构建的免疫细胞评分(图 3)。这8种免疫细胞分别为:活化的肥大细胞,活化的树突状细胞,M1巨噬细胞,M2巨噬细胞,静止期肥大细胞,静止期树突状细胞,初始B细胞,单核细胞。用免疫细胞评分做cutoff,将免疫细胞评分划分为高低两个组进行生存分析,结果显示高免疫细胞评分的NSCLC患者预后生存时间较短(HR=1.84;P-value < 0.000 1;中位生存时间35.77个月比57.5个月;95% CI:1.36–2.48) (图 4)。然后,免疫细胞评分结合临床特征做COX单因素与多因素分析,使用退火法筛选特征后,最后保留4个特征:病理分期(Pathological stage),T分期(Tstage),放疗(Radiation therapy)和ICS,以这4个特征构建了NSCLC预后模型列线图,如图 5所示。经1000次bootstrap抽样方法进行验证后,C-index为0.71。

|
| 图 3 LASSO回归构建免疫细胞评分 Fig. 3 Construction of ICS by LASSO regression. (A) Ten fold cross-validation for tuning parameter selection in the LASSO model. The numbers above the graph represent the number of cell types involved in the LASSO model. (B) The curve intersecting the red dotted line represents the type of immune cells involved in the LASSO model: A-Mast cells activated; B-Dendritic cells activated; C-Macrophages M1; D-Macrophages M2; E-Mast cells resting; F-Dendritic cells resting; G-B cells naive; H-Monocytes. |
| |

|
| 图 4 免疫细胞评分生存分析 Fig. 4 Survival analysis of ICS. (A) Survival analysis of ICS in training set. (B) Survival analysis of ICS in testing set. |
| |

|
| 图 5 NSCLC预后模型列线图 Fig. 5 Nomogram of prognosis model of NSCLC. |
| |
在训练集中,以所有病人的风险值做cutoff,将病人分为两组,根据两组病人的log-rank检验统计量来筛选病人分组阈值。如图 6所示,当选取2.43作为cutoff时,两组病人log-rank检验统计量达到最大,因此选取2.43第一个阈值对患者进行分组。对剩下的患者继续进行分组,选取cutoff=1.7为阈值,这样将患者分成高、中、低风险3个组。相对低风险组,中风险组HR=2.69,95% CI:1.9–3.79,高风险组HR=6.36,95% CI:4.24–9.55,经log-rank检验P-value=1.45e–23。中位生存时间:低风险组61.0个月,中风险组31.7个月,高风险组20.8个月。然后,对模型预测NSCLC患者3年和5年的存活率做了校准曲线(图 7A,7B),校准曲线均拟合良好。用训练集中的免疫细胞评分公式代入测试集中,图 4B结果验证了高免疫细胞评分的NSCLC患者预后生存时间较短(HR=1.66;P-value=0.0016;中位生存时间35.57个月比66.13个月;95% CI:1.21–2.29)。测试集中,模型预测NSCLC患者3年和5年的存活率校准曲线也都拟合良好(图 7C和图 7D)。经1 000次bootstrap抽样方法进行验证后,C-index为0.702。综上,经过训练集模型的评估及测试集的验证,表明构建的预后模型可以实现准确的预测NSCLC患者的3年和5年存活率。

|
| 图 6 训练集中NSCLC预后模型高中低风险分组生存分析比较 Fig. 6 Survival analysis of prognosis model of NSCLC was compared with high, medium and low risk group in training set. (A, B) Threshold values for patient grouping were screened based on log-rank test statistics. (C) Survival analysis of high, medium and low risk group. |
| |

|
| 图 7 NSCLC预后模型3年和5年校准曲线图 Fig. 7 Calibration curves of 3-year and 5-year of prognosis model of NSCLC. (A, B) Calibration curves of 3-year and 5-year of NSCLC prognosis model in training set. (C, D) Calibration curves of 3-year and 5-year of NSCLC prognosis model in testing set. |
| |
此次研究以22种免疫细胞占比为特征用机器学习方法构建了NSCLC分类模型。与Yu等将传统的阈值和图像处理技术与机器学习方法相结合、Girard等以62种基因为特征采用最近距离法及Du等以STC1 mRNA为特征通过计算约登指数得到最佳截断点将NSCLC肿瘤与正常组织分类相比,我们用随机森林方法,构建的NSCLC肿瘤组织与正常组织分类模型、LUAD和LUSC肿瘤组织分类模型结果显示出更高的准确度。
通过应用新开发的CIBERSORT工具和LASSO回归构建了由8种免疫细胞组成的免疫细胞评分。免疫细胞评分结合临床特征构建了NSCLC预后模型,经1 000次bootstrap抽样方法进行验证后C-index为0.71。预后模型的风险度高中低分组后做生存分析,经log-rank检验P-value=1.45e-23。预后模型中训练集与测试集的3年与5年校准曲线都拟合良好,且测试集中经1 000次bootstrap抽样方法进行验证后C-index为0.702。模型评估与验证表明了该预后模型对NSCLC的预后具有良好的预测能力。
基于免疫细胞浸润构建的NSCLC分类模型和预后模型说明了免疫细胞浸润与其发生和发展存在的关联。分类模型能够有效地从NSCLC患者和健康对照人群中识别NSCLC患者(包括LUAD与LUSC患者),预后模型能够有效地对NSCLC病人3年和5年存活率进行预测,提示不同免疫细胞类型在NSCLC发生发展过程中的作用。这一发现为从免疫细胞浸润的角度对NSCLC诊断与预后研究提供新的策略。此外,基于本研究建立的模型,我们构建了网页工具(http://www.biostatistics.online/NSCLC/home.php),供研究者实际应用于NSCLC诊断和预后的预测。
本研究方案虽然在NSCLC诊断与预后中取得进展,但也存在不足之处。研究中用的是公开的数据集,不可能获得每个病人所需的所有信息。这表明,一些患有急性感染、患有免疫系统疾病或服用抗炎药的患者,有可能被纳入了这项研究。理想情况下,这些患者应该被排除在外。另外对于目前公开可用的肿瘤基因组图谱数据库中,正常肺组织基因表达数据较肿瘤组织基因表达数据少,这就导致了收集数据时样本的不平衡。但是,伴随着目前高通量基因表达检测技术的发展,会有越来越多的基因表达数据可供研究。在未来的研究中,我们将收集更多的NSCLC患者数据及正常组织数据,继续对NSCLC的诊断与预后进行进一步研究。
| [1] |
Siegel RL, Miller KD, Jemal A. Cancer statistics, 2017. CA Cancer J Clin, 2017, 67(1): 7-30. |
| [2] |
Mitchell PL, John T. Lung cancer in 2016: immunotherapy comes of age. Lancet Respir Med, 2016, 4(12): 947-949. |
| [3] |
Hirsch FR, Scagliotti GV, Mulshine JL, et al. Lung cancer: current therapies and new targeted treatments. Lancet, 2017, 389(10066): 299-311. |
| [4] |
Hanna N, Johnson D, Temin S, et al. Systemic therapy for stage Ⅳ non-small-cell lung cancer: American society of clinical oncology clinical practice guideline update. J Clin Oncol, 2017, 35(30): 3484-3515. |
| [5] |
Yu KH, Zhang C, Berry GJ, et al. Predicting non-small cell lung cancer prognosis by fully automated microscopic pathology image features. Nat Commun, 2016, 7: 12474. |
| [6] |
Girard L, Rodriguez-Canales J, Behrens C, et al. An expression signature as an aid to the histologic classification of non-small cell lung cancer. Clin Cancer Res, 2016, 22(19): 4880-4889. |
| [7] |
Du YZ, Gu X H, L iL, et al. The diagnostic value of circulating stanniocalcin-1 mRNA in non-small cell lung cancer. J Surg Oncol, 2011, 104(7): 836-840. |
| [8] |
Siegel R, Desantis C, Virgo K, et al. Cancer treatment and survivorship statistics, 2012. CA Cancer J Clin, 2012, 62(4): 220-241. |
| [9] |
Ettinger DS, Wood DE, Akerley W, et al. NCCN guidelines insights: non-small cell lung cancer, Version 4.2016. J Natl Compr Canc Netw, 2016, 14(3): 255-264.
|
| [10] |
Ouyang J, Sun Y, Li W, et al. dbPHCC: a database of prognostic biomarkers for hepatocellular carcinoma that provides online prognostic modeling. Biochim Biophys Acta, 2016, 1860(11 Pt B): 2688-2695. |
| [11] |
Wu J, Zhou L, Huang L, et al. Nomogram integrating gene expression signatures with clinicopathological features to predict survival in operable NSCLC: a pooled analysis of 2164 patients. J Exp Clin Cancer Res, 2017, 36(1): 4. |
| [12] |
Sun HC, Xie L, Yang XR, et al. Shanghai score: A prognostic and adjuvant treatment-evaluating system constructed for Chinese patients with hepatocellular carcinoma after curative resection. Chin Med J (Engl), 2017, 130(22): 2650-2660. |
| [13] |
Liu X, Wu S, Yang Y, et al. The prognostic landscape of tumor-infiltrating immune cell and immunomodulators in lung cancer. Biomed Pharmacother, 2017, 95: 55-61. |
| [14] |
Newman AM, Liu CL, Green MR, et al. Robust enumeration of cell subsets from tissue expression profiles. Nat Methods, 2015, 12(5): 453-457. |
| [15] |
Bindea G, Mlecnik B, Tosolini M, et al. Spatiotemporal dynamics of intratumoral immune cells reveal the immune landscape in human cancer. Immunity, 2013, 39(4): 782-795. |
| [16] |
Ali HR, Chlon L, Pharoah PD, et al. Patterns of immune infiltration in breast cancer and their clinical implications: A gene-expression-based retrospective study. PLoS Med, 2016, 13(12): e1002194. |
| [17] |
Xiong Y, Wang K, Zhou H, et al. Profiles of immune infiltration in colorectal cancer and their clinical significant: A gene expression-based study. Cancer Med, 2018, 7(9): 4496-4508. |
| [18] |
Zeng D, Zhou R, Yu Y, et al. Gene expression profiles for a prognostic immunoscore in gastric cancer. Br J Surg, 2018, 105(10): 1338-1348. |
| [19] |
Huang DW, Sherman BT, Tan Q, et al. The DAVID gene functional classification tool: a novel biological module-centric algorithm to functionally analyze large gene lists. Genome Biol, 2007, 8(9): R183. |
| [20] |
Kuner R, Muley T, Meister M, et al. Global gene expression analysis reveals specific patterns of cell junctions in non-small cell lung cancer subtypes. Lung Cancer, 2009, 63(1): 32-38. |
| [21] |
Scholkopf B, Smola AJ, Williamson RC, et al. New support vector algorithms. Neural Comput, 2000, 12(5): 1207-1245. |
| [22] |
Zhang YQ, Lin Y. Research of prediction of the response to tumor immunotherapy based on machine learning. Comp Eng Software, 2019, 40(1): 97-102 (in Chinese). 张雨琦, 林勇. 基于机器学习的肿瘤免疫治疗应答预测研究. 软件, 2019, 40(1): 97-102. |
| [23] |
Tibshirani R. Regression Shrinkage and Selection via the Lasso. J Royal Statist Soc, 1996, 58(1): 267-288. |
 2020, Vol. 36


